NC Traffic Safety Conference & Expo Visualizations and Data
This is a list of all the dashboards created to help inform the staff, organizers, exhibitors, and speakers. Please do not share the data with others, it may complicate the marketing messages for the upcoming conferences. Questions? Want something added or changed? Email Matt Kuliani: mlkull@ncsu.edu.
Recent Conference Visualizations
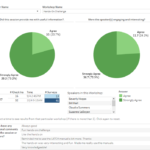
2022 NCTSC Conference Analysis Dashboard
This dashboard shows the session data from the 2022 NC Traffic Safety Conference as gathered from Cvent and the conference app.
Open Visualization
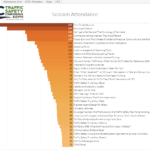
2022 NCTSC Web App Analysis Dashboard
This dashboard shows the web app data from the 2022 NC Traffic Safety Conference as gathered from the conference app.
Open Visualization
Previous Visualizations from Prior Conferences
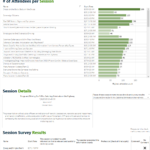
2019 Sessions Dashboard
This dashboard shows the session data from the 2019 NC Traffic Safety Conference as gathered from Cvent and the conference app.
Open Visualization
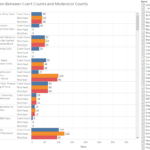
2019 Attendance Comparison
This is a comparison between the three counting styles used during the 2019 NCTSC.
Cvent = # of scans recorded by the Cvent scanners that moderators used to scan in attendance to the session
Mod Head = # that the moderator counted once the session started, recorded on paper
Mod Scan = # that the moderator counted that was actually scanned by the Cvent scanners, recorded on paper.
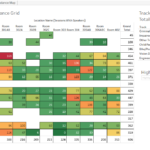
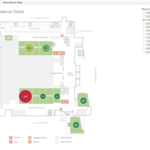
The attendance count uses the highest # by any count (moderator, Cvent). Click the Highlight Track box to choose which track to highlight. Notice that there are two tabs at the top, Attendance Grid and Attendance Map. The map allows filtering based on time showing where the attendees were during each session time period. Only times when teaching sessions were being presented are available in the map as all other "sessions" such as the plenaries and the exhibit halls do not make sense to map them (no attendee count, everyone in one place, etc).
Open Visualization2019 Session Analysis Dashboard
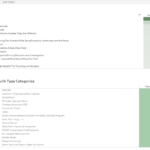
This dashboard analyzes the session data with regards to location and the type of attendee in the sessions.
Open Visualization