Vision Zero Analytics
What is NC Vision Zero Analytics?
Track
Track
GHSP Highway Safety Plan performance goals by geographic areas
Visualize
Visualize
patterns and trends by jurisdictional responsibility
Identify
Identify
effective data-driven strategies for preventing crashes
NC Vision Zero Analytics (NCVZA) is an online data visualization system for safety stakeholders to track traffic safety goals and identify effective data-driven strategies for reducing traffic fatalities in North Carolina.
Go to Vision Zero Analytics
Why NCVZA?
NCVZA provides a uniform way to track and measure Highway Safety Plan (HSP) crash reduction performance goals statewide among all safety partner stakeholders. Aligning, tracking and visualizing crash reduction performance goals and trends among all agencies provides a data-driven foundation for identifying countermeasure activities that align with the state’s overall crash reduction mission.
How Can NCVZA Help?
The system provides user-specific “views” for different audiences based on geographic areas of responsibility (statewide, troop, troop district, county, LEL). Users are provisioned with views specific for their needs, so they can flexibly adapt planning strategies to more effectively improve traffic safety. This approach is common practice in the business world for making better business decisions.
Who Uses NCVZA?
The main audiences for NCVZA are NC Highway Patrol field supervisors, NC Highway Patrol command staff, statewide Law Enforcement Liasons (LELs), and GHSP staff. Our goal is to add all law enforcement safety partners statewide for collectively improving traffic safety outcomes.
Performance Tracking
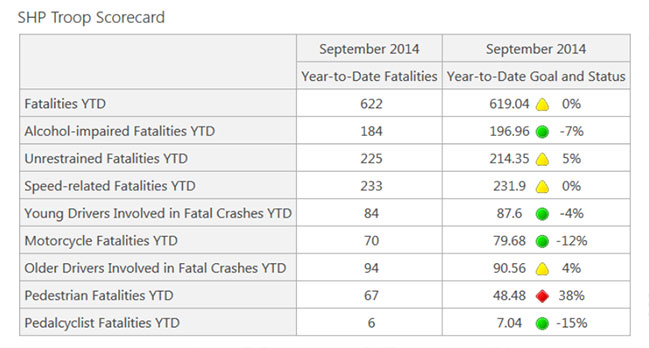
Safety partners continuously track how they are performing against state-level crash reduction goals set forth in the state’s Highway Safety Plan (HSP). This helps identify performance gaps, a first step for developing effective strategies for improvement.


Interactive Visualization
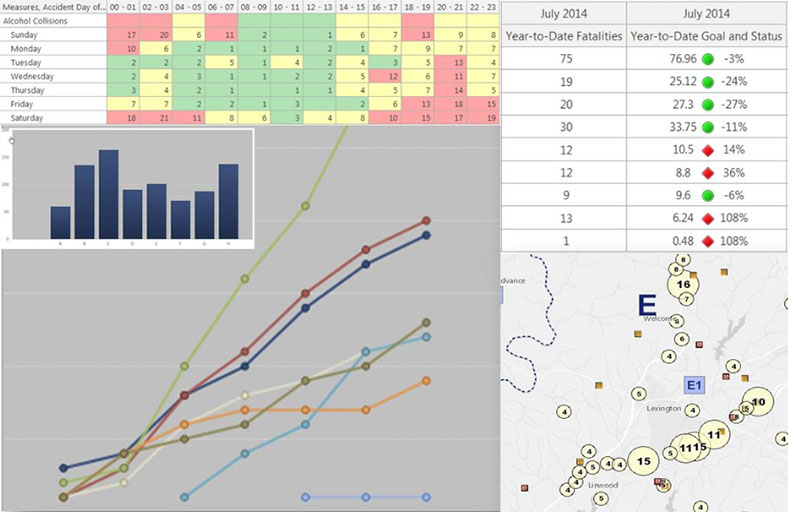
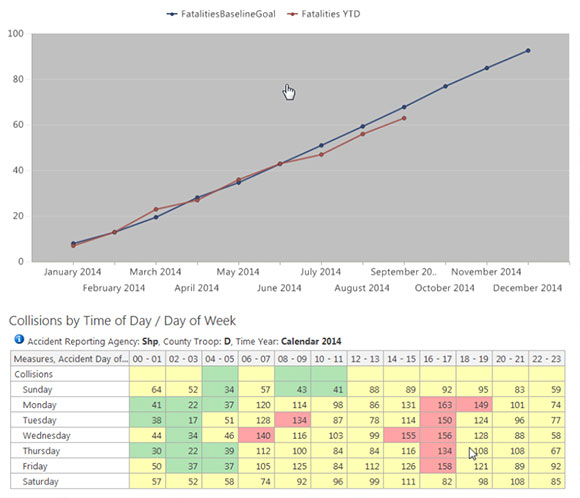
Users can also view their performance over time and interactively sweep the data to visualize patterns and trends, including the ability to drill down to visualize contributing circumstances and other relevant information. This provides staff with data-driven intelligence so that they can adapt enforcement strategies to maximize effectiveness.
Map Analytics
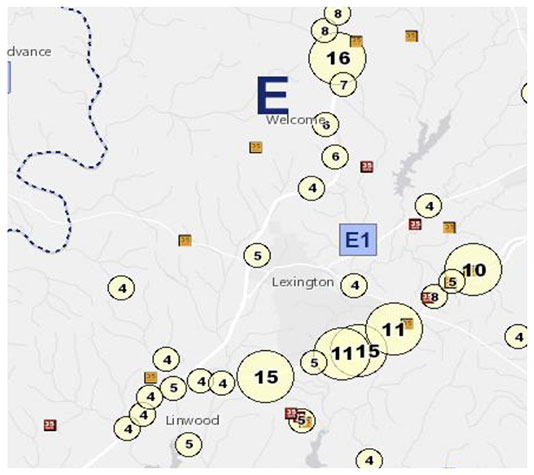
Users can see where clusters of crashes are using online maps, as well as link to individual crash reports, a key capability for determining appropriate countermeasures.
